
Success rate trade-off for students and schools
There is a trade-off between the success rates of students and those of schools. A school can enhance its image by evicting less performing students, so that only good students contribute to the success rate. Less performing students are directed to schools with lower requirements. Nicely said: there can be schools with different levels that better fit their target populations. Is the latter too good to be true ?
“De Maatschappij” (“The society”) is an independent network for people active in business and public service. On June 14 they organised a discussion about education (in-) equality. This obviously relates to success rates.
(PM. The location was the beautiful Hodshon House in Haarlem, seat of the “Koninklijke Hollandsche Maatschappij der Wetenschappen” (KHMW) (“Royal Society of the Province of Holland for the Sciences”) founded in 1752. In this case “Holland” stands for the province and not the whole country.)
Arnold Jonk of “Onderwijsinspectie” (Inspectorate of Education) presented results of the annual survey “De staat van het onderwijs” (a series of reports since 1817). He observed that inequality increases, notably by the statistical phenomenon that children of parents with lower education have increasingly less enjoyment of higher education themselves. Jonk argued that the data showed no single cause. He also observed that inequality between schools is rising.
The discussion caused me to think that the success rate for schools should be corrected for the opportunities that are granted to weaker students. Giving an opportunity should not be punished, in the event when the student still fails.
Other people have already thought about this, see this recent discussion about including CITO scores, e.g. on the website of schools comparing each other. Yet, I find it helpful to organise my thoughts on this, so that I know better what to look for in the future. The discussion at KHMW was open, and then I don’t mind mentioning an idea that isn’t fully developed yet, even though other people may not understand what you are getting at, or think that you are reinventing the wheel. Science is open. The following exposition should be helpful, and is still preliminary.
Item Response Theory clarifies that tests say something about students, but also conversely that students say something about the test. Something must be said about the school too. At the Dutch Inspectorate of Education there are measures on the output of schools, e.g. the “Opbrengstenkaart” formerly known as “kwaliteitskaart” for secondary education. Google showed this book “Het oog der natie, scholen op rapport” (2001). An informative discussion in Dutch is by Janssens & Visscher (undated). The PISA methodology aggregates results for countries, and a similar method might be used for schools. In Belgium, Frank Roels (emeritus) has a popular and partly entertaining discussion (in Dutch) about success rates and ways to manipulate those. Yet, I haven’t looked at these methods in detail.
For this weblog entry I only want to get some preliminary clarity about the problem, by using a simple example, so that it should be clear what the problem is.
Must John retake the junior year or will he be admitted to the senior year ?
Consider a highschool with grades 9-12: freshmen, sophomores, juniors and seniors. Each class consists of approximately 25 normal students. The school accepts that 1 student normally fails at graduation. This failure rate of 4% translates into a success rate of 96%.
Consider John at the end of the junior year (grade 11). He wants to enter the senior year (grade 12) and graduate next year. John is a weak student and differs a bit from the 25 normal students that are admitted without problem (including the one who failed last year). The school wonders about what to do with John. If John would be admitted but fails graduation next year, then this will affect the school success rate unfavourably, for this means a failure of (1 + 1) / (25 + 1) = 2 / 26 ≈ 7.69% or a success of 24 / 26 ≈ 92.31%. Perhaps it is better for John to retake the junior year, and be better prepared for the senior year ? The school has a policy that students may only retake one year. If John would fail twice in the junior year, he is removed from the school. Then it is favourable for the school that he no longer shows up in the school graduation success rate. For John it might be better to go to the senior year directly, for then he has the option to try for graduation twice.
In sum: for John it is better that he is admitted to the senior year (path A), for the school it is better to let him retake the junior year (path B). Assuming some transition probabilities, the following table summarizes the cumulated rates of success for John versus the school for the two paths. The Appendix below shows how this table was constructed.
When a school district has a rule that schools should have a two year average success rate of at least 95%, then the school will be inclined to steer towards path B. In this case the school is small and fluctuations can be explained, but still.
| Path |
John’s success rate |
School weighted average success rate |
| A. Admit |
85% |
94.9% |
| B. Retake |
48% |
95.4% |
Considerations
W.r.t. rising inequality, it is unclear to me whether above perverse selection effect occurs. Having different levels of education already mitigates the effect. Schools with low education levels might already have high success rates, because they collect the dropouts of the higher levels. Still the overall effect might be a reduction of the level.
Schools with high levels may also have high success because of the selection, and not be in need for additional money. The better schools might have the market power to select the better students. Higher educated parents may provide for extra stimulus. For lower educated parents this stimulus would have to be provided by the schools, but those may not have the resources. In that case, the government might give more money to the lower level schools. In the middle, the schools with more aspiration who give students more opportunity are punished because their success rates drop, and they are less likely to get government money.
This discussion tends to interprete the school success rate as applying to the school, but it is a student average. Our real focus is on the overall success rate for all students. This includes the probability that the weaker student John also graduates. Thus the school success rate should better be corrected for giving John this opportunity.
In Item Response Theory (IRT), only students with their competences and the tests with their challenges occur, and there is no school indeed. The individual transition probabilities however are affected by the quality of the teachers, whence IRT must be corrected for the school effect. Indeed, it is a general notion that the quality of teachers is one of the main instruments, as argued by Cornet et al. (2006) at CPB. Jochems (2007) however argued that we know relatively little about education of teachers.
A quick fix
Above weighted average punishes John for requiring one more year to graduate. A quick fix is to eliminate John from the calculation when he fails in the first senior year, conditional on that we know that he will succeed the second time. When the school success rate is based upon the remaining normal students, then this suffices for the school image. In the table below we replace the low success rate of .9231 (in red) by the normal .96, as if John didn’t participate. As a result, the weighted average rises from 94.9 to 95.5. The school is rewarded by a higher success score than along path B.
Now, however, the average duration at school enters the discussion. This quick fix is neutral for the delay that already occurs for John. It however assumes that schools and students do not manipulate by turning a failing normal student into a weak student. Allowing students an additional year is a luxury for the school. Potentially though students want to graduate as fast as possible. This quick fix introduces for policy makers a delay in the outcome (with first an estimate only). I have only looked at this numerical example and not looked at the conditions on the parameters. This is just an example case, and we would have to look how it works out, say in IRT. A label for this kind of research might be “opportunity neutral or rewarding success rates”, but perhaps a known or better label already exists. Perhaps this small model then is helpful for discussion.
Why is this important ?
Better control of the transition probabilities and good measures of success are important for the management of the educational system in general. There is also this important question of design: we have differentiation in Secondary Education, so why not in Primary Education ? This gives more application for success rates. Would it not be better to replace the rather uniform system of Primary Education by a differentiated system that is more sensitive to the capabilities of the pupils ? This proposal comes from Henk Boonstra, and I tend to agree, see here, though be warned that I am not qualified for PE.
When you are sick, you go to a hospital, get monitored, and when cured return to society. For prevention, there should be constant monitoring and regular checks. For schools, we would look not only at the dropouts and low achievers but also at students functioning below their capacity in general. If John in the model above fails, he should get another diploma fitting to his results, and the true question is whether he has reached his capacity (or good basis for a career of choice). We are going to a society that keeps a digital image of your body and mind. The science of testing is with us since phrenology started, but now we need ever better systems to check upon both science and how it is applied.
Appendix on model and numerical example
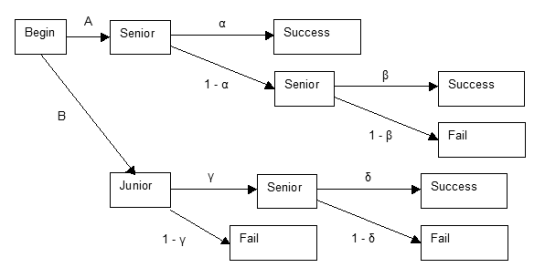
There are two main paths A and B with each three endpoints, see the diagram. Let us use the following numerical example of John’s individual chances.
- the probability that John graduates next year: α = 50%
- the probability that John graduates after retaking the senior year: β = 70%
- the probability that John becomes a senior after retaking the junior year: γ = 80%
- the probability that John graduates after retaking the junior year: δ = 60%
| Path | John’s success rate | School success rate, years 1 and 2 |
| (A1) Senior-Graduate | α = .5 | 25 / 26 ≈ .9615, 24 / 25 = .96 |
| (A2) Senior-Senior-Graduate | (1 – α) β = .5 × .7 = .35 | 24 / 26 ≈ .9231, 25 / 26 ≈ .9615 |
| (A3) Senior-Senior-Fail | (1 – α) (1 – β) = .5 × .3 = .15 | 24 / 26 ≈ .9231, 24 / 26 ≈ .9231 |
| (B1) Junior-Senior-Graduate | γ δ = .8 × .6 = .48 | 24 / 25 = .96, 25 / 26 ≈ .9615 |
| (B2) Junior-Senior-Fail | γ (1 – δ) = .8 × .4 = .32 | 24 / 25 = .96, 24 / 26 ≈ .9231 |
| (B3) Junior-Fail | (1 – γ) = .2 | 24 / 25 = .96, 24 / 25 = .96 |

View on Haarlem, June 14 2016
