
Teaching Simpson’s paradox at elementary school
Robert Siegler participates in the “Center for Improved Learning of Fractions” (CILF) and was chair of the IES 2010 research group “Developing Effective Fractions Instruction for Kindergarten Through 8th Grade” (report) (video).
IES 2010 key advice number 3 is:
“Help students understand why procedures for computations with fractions make sense.”
The first example of this helping to understand is:
“A common mistake students make when faced with fractions that have unlike denominators is to add both numerators and denominators. [ref 88] Certain representations can provide visual cues to help students see the need for common denominators.” (Siegler et al. (2010:32), refering to Cramer, K., & Wyberg, T. (2009))
For a / b “and” c / d kids are supposed to find (ad + bc) / (bd) instead of (a + c) / (b + d).
Obviously this is a matter of definition. For “plus” we define: a / b + c / d = (ad + bc) / (bd).
But we can also define “superplus”: a / b ⊕ c / d = (a + c) / (b + d).
The crux lies in “and” that might not always be “plus”.
When (a + c) / (b + d) makes sense
There are cases where (a + c) / (b + d) makes eminent sense. For example, when a / b is the batting average in the Fall-Winter season and c / d the batting average in the Spring-Summer season, then the annual (weighted) batting average is exactly (a + c) / (b + d). Kids would calculate correctly, and Siegler et al. (2010) are suggesting that the kids would make a wrong calculation ?
The “superplus” outcome is called the “mediant“. See a Wolfram Demonstrations project case with batting scores.
Adding up fractions of the same pizza thus differs from averaging over more pizzas.
We thus observe:
- Kids live in a world in which (a + c) / (b + d) makes eminent sense.
- Telling them that this is “a mistaken calculation” is actually quite confusing for them.
- Thus it is better teaching practice to explain to them when it makes sense.
There is no alternative but to explain Simpson’s paradox also in elementary school. See the discussion about the paradox in the former weblog entry. The issue for today is how to translate this to elementary school.
Cats and Dogs
Many examples of Simpson’s paradox have larger numbers, but the Kleinbaum et al. (2003:277) “ActivEpi” example has small numbers (see also here). I add one more to make the case less symmetrical. Kady Schneiter rightly remarked that an example with cats and dogs will be more appealing to students. She uses size (small or large pets) as a factor, but let me stick to the idea of gender as a confounder. Thus the kids in class can be presented with the following case.
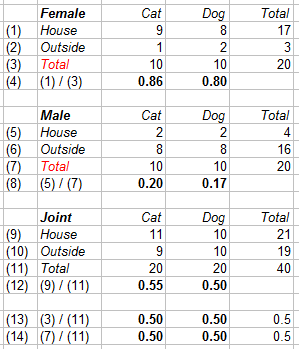
- There are 17 cats and 16 dogs.
- There are 17 pets kept in the house and 16 kept outside.
- There are 17 female pets and 16 male pets (perhaps “helped”).
There is the phenomenon – though kids might be oblivious why this might be “paradoxical”:
- For the female pets, the proportion of cats in the house is larger than the proportion for dogs.
- For the male pets, the proportion of cats in the house is larger than the proportion for dogs.
- For all pets combined, the proportion of cats in the house is smaller than the proportion for dogs.
The paradoxical data
The paradoxical data are given as follows. Observe that kids must calculate:
- For the cats: 6 / 7 = 0.86, 2 / 10 = 0.20 and (6 + 2) / (7 + 10) = 0.47.
- For the dogs: 8 / 10 = 0.80, 1 / 6 = 0.17 and (8 + 1) / (10 + 6) = 0.56.

A discussion about what this means
Perhaps the major didactic challenge is to explain to kids that the outcome must be seen as “paradoxical”. When kids might not have developed “quantitative intuitions” then those might not be challenged. It might be wise to keep it that way. When data are seen as statistics only, then there might be less scope for false interpretations.
Obviously, though, one would discuss the various views that kids generate, so that they are actively engaged in trying to understand the situation.
The next step is to call attention to the sum totals that haven’t been shown above.

It is straightforward to observe that the F and M are distributed in unbalanced manner.
The correction
It can be an argument that there should be equal numbers of F and M. This causes the following calculations about what pets would be kept at the house. We keep the observed proportions intact and raise the numbers proportionally.
- For the cats: 0.86 * 10 ∼ 9, and (9 + 2) / (10 + 10) = 0.55.
- For the dogs: 0.17 * 10 ∼ 2, and (8 + 2) / (10 + 10) = 0.50.
And now we find: Also for all pets combined, the proportion of cats in the house is larger than the proportion for dogs. Adding up the subtables into the grand total doesn’t generate a different conclusion on the proportions.
Closure on causality
Perhaps kids at elementary school should not bothered with discussions on causality, certainly not on a flimsy case as this. But perhaps some kids require closure on this, or perhaps the teacher does. In that case the story might be that the kind of pet is the cause, and that the location where the pet is kept is the effect. When people have a cat then they tend to keep it at home. When people have a dog then are a bit more inclined to keep it outside. The location has no effect on gender. The gender of the pet doesn’t change by keeping it inside or outside of the house.
Vectors in elementary school
Pierre van Hiele (1909-2010) explained for most of his professional life that kids at elementary school can understand vectors. Thus, they should be able to enjoy this vector graphic by Alexander Bogomolny.
Van Hiele also proposed to abolish fractions as we know them, by replacing y / x by y x^(-1). The latter might be confusing because kids might think that they have to subtract something. But the mathematical constant H = -1 makes perfect sense, namely, check the unit circle and the complex number i. Thus we get y / x = y xH. The latter would be the better format. See “A child wants nice and no mean numbers” (2015).
Conclusions
Some conclusions are:
- What Siegler & IES 2010 call a “common mistake” is the proper approach in serious statistics.
- Teaching can improve by explaining to kids what method applies when. Adding fractions of the same pizza is different from calculating a statistical average. (PM. Don’t use round pizza’s. This makes for less insightful parts.)
- Kids live in a world in which statistics are relevant too.
- Simpson’s paradox can be adapted such that it may be tested whether it can be discussed in elementary school too.
- The discussion corroborates Van Hiele’s arguments for vectors in elementary school and the abolition of fractions as we know them (y / x) and the use of y xH with H = -1. The key thing to learn is that there are numbers xH such that x xH = 1 when x ≠ 0, and the rest follows from there.
PM. The excel sheet for this case is: 2017-01-30-data-from-kleinbaum-2003-adapted.
